LORIS
LORIS Database Overview
Disclaimer:
The Nathan Kline Institute-Rockland Sample is an ongoing program of research available to you pre-publication. In order to release the widest range of data, we do minimal data cleaning and validation. We highly encourage researchers who use our data to do their own validation and quality control checks. You may contact us at RocklandSample.Enduser@nki.rfmh.org with feedback, questions, or corrections.
Requesting Data in LORIS
There are 2 levels of access for the NKI-RS data:
- Anonymized imaging data and minimal demographic information, such as Age, Sex, and Handedness is openly accessible. These data can be downloaded though AWS S3, and the instructions for doing so are here
One can also use the AWS cli tools and connect to the bucket at:
"s3://fcp-indi/data/Projects/RocklandSample/RawDataBIDSLatest"
- Accessing the full set of phenotypical data requires a Data Usage Agreement (DUA). Instructions on how to do so are here . After a DUA is completed, the data may be accessed via COINS or LORIS.
Note: There are slight differences between assessment codes in COINS and LORIS. The crosswalk between the codes can be downloaded here.
Loris Instructions
Step 1: Requesting Access
After completing the DUA, user accounts for LORIS can be requested though the Rockland Sample contact email: RocklandSample.Enduser@nki.rfmh.org
Step 2: Logging In
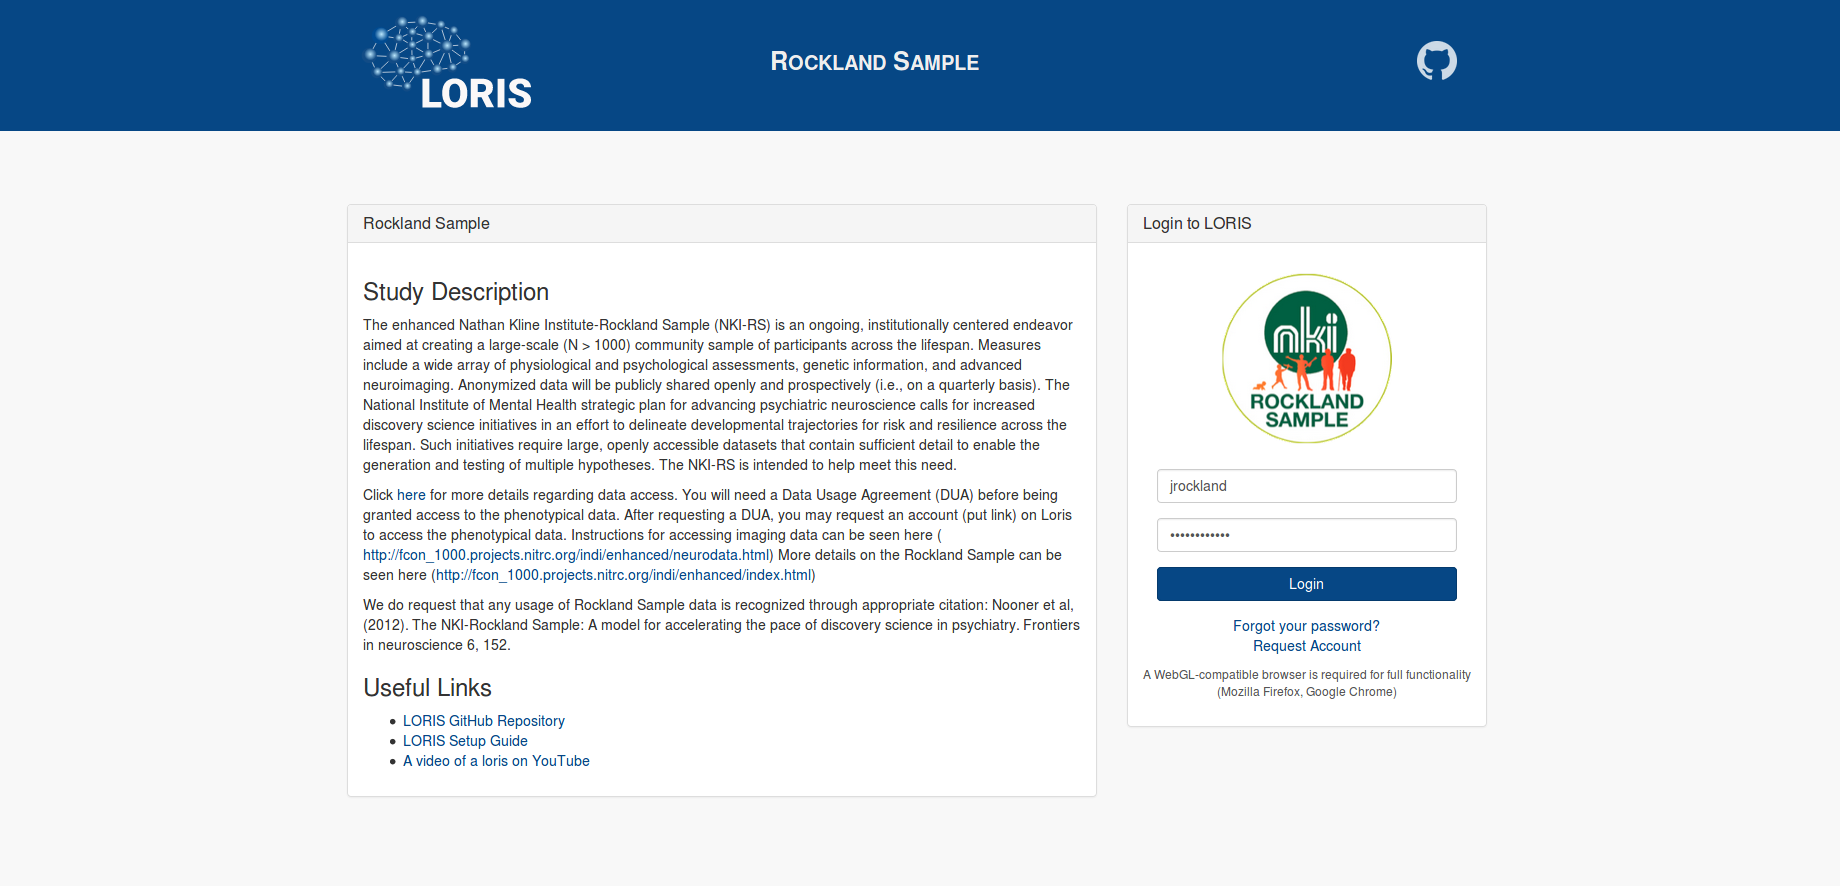
The Rockland Sample data on LORIS can be accessed at: https://data.rocklandsample.rfmh.org/. Login by entering your username and password into the box labelled “Login to LORIS”. Note, currently the “Request Account” button on the LORIS website is not functional (see step 1).
 Step 3: Selecting Data
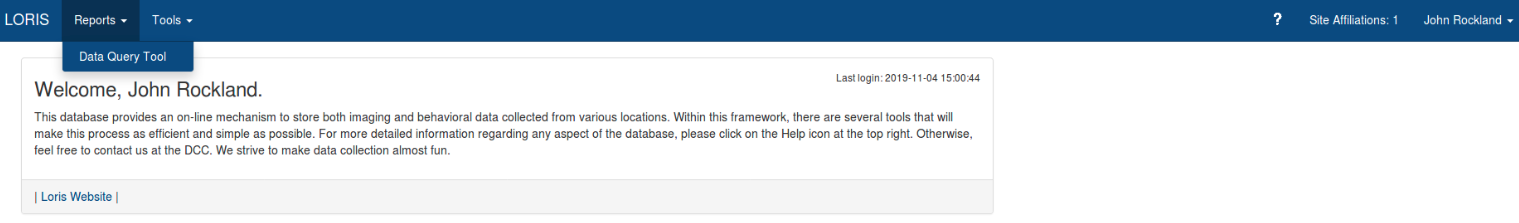
To get to the Data Query tool, go to the top bar, and select “Reports” then “Data Query Tool”.
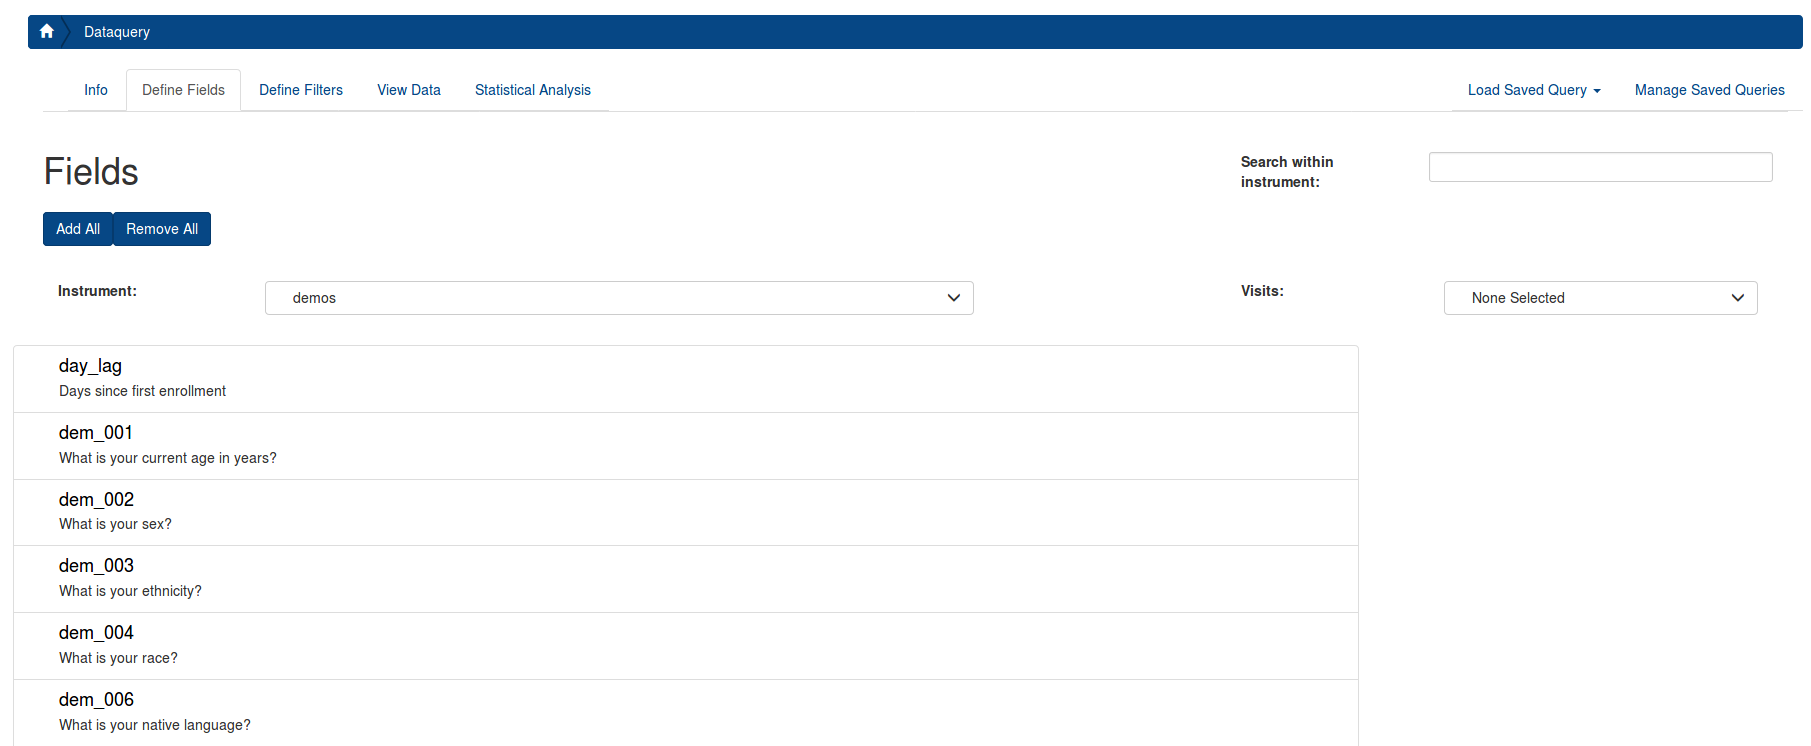
Select the tab “Define Fields”, and enter an Assessment (in LORIS they are referred as “Instrument”) that you want to include in your data export. The variables (in LORIS they are referred as “Fields”) from the instrument will populate the page.
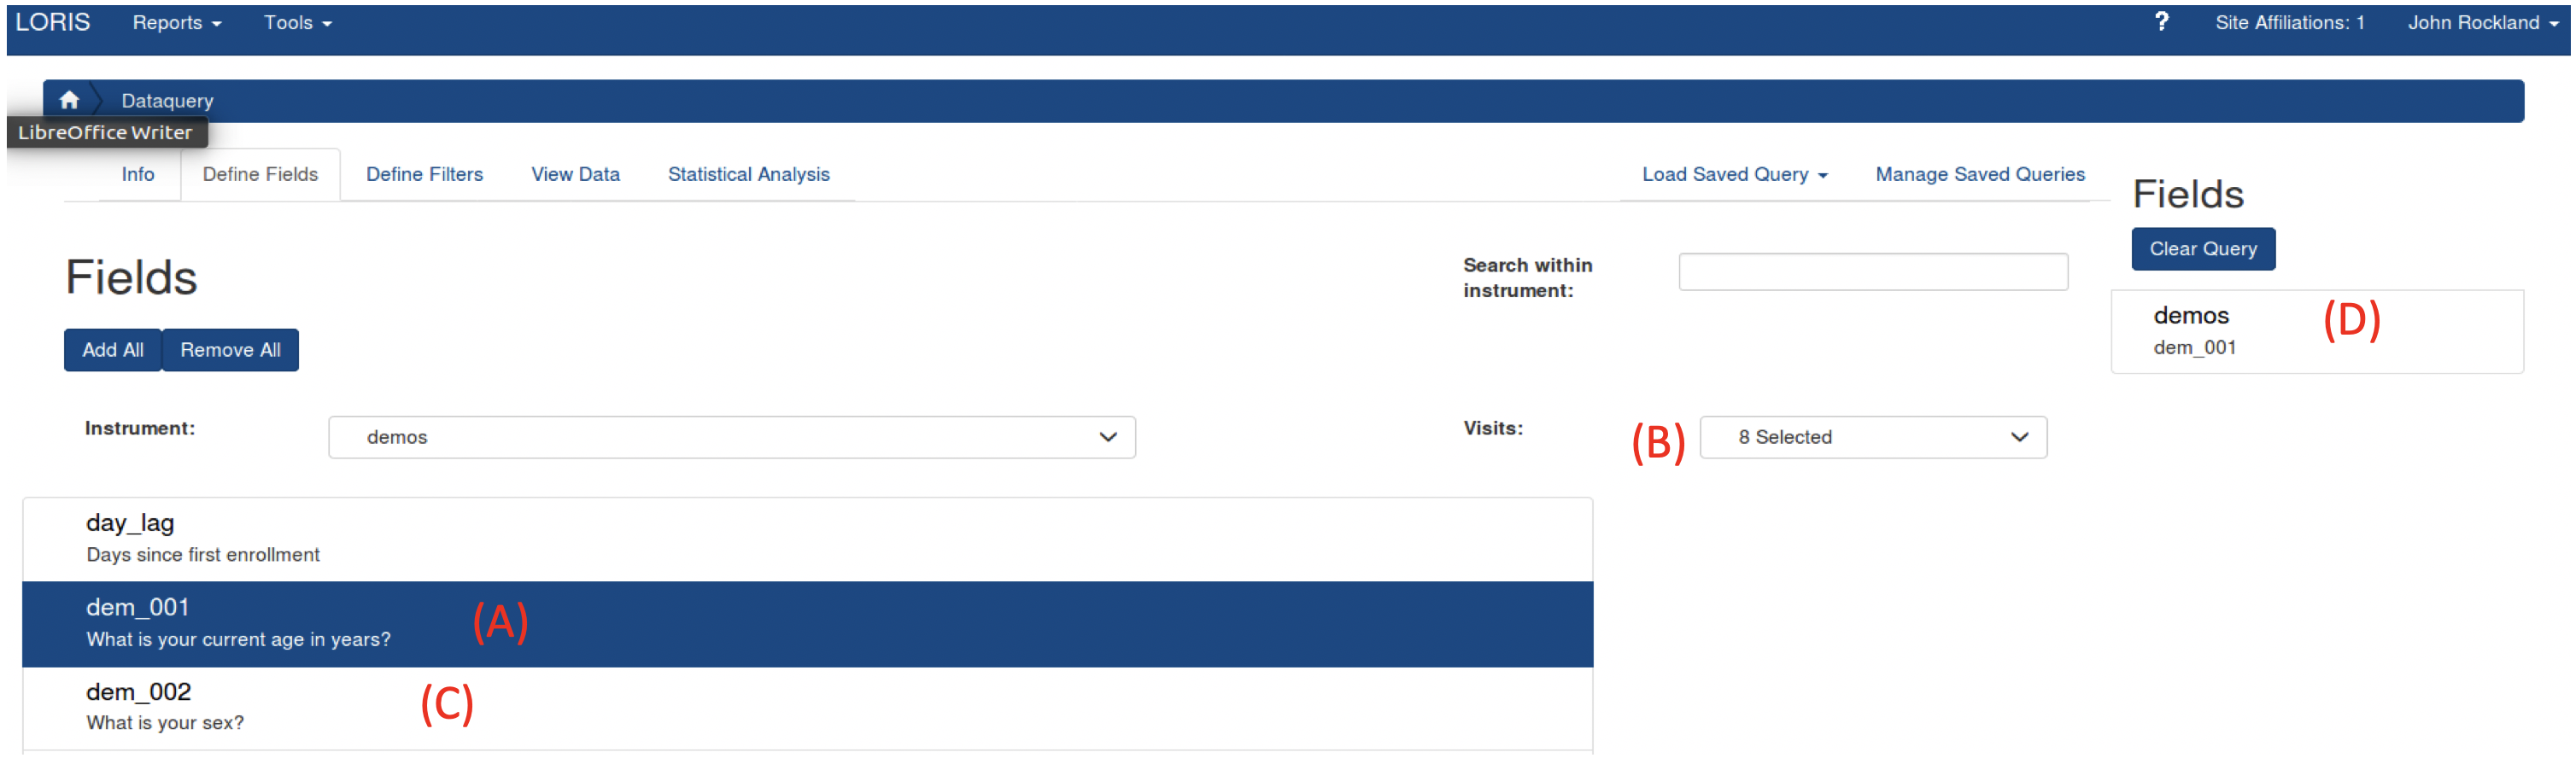
 After you select your first Field (A), select Visits (B) from the box on the right (Details describing the visits can be seen here). Then, select the desired Fields by clicking the on each one (C). Selected Fields will populate on the rightmost column (D). You can scroll through all instruments to choose Fields for your exported datafile.
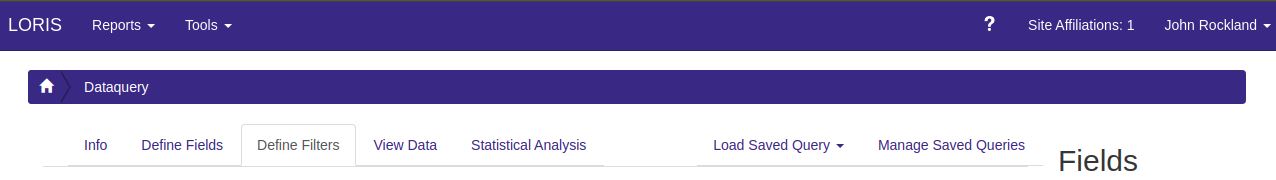
Step 4: Filtering Data
If you choose to filter the data, select the “Define Filters” tab. If you do not want to filter the data, you can skip to Step 4.
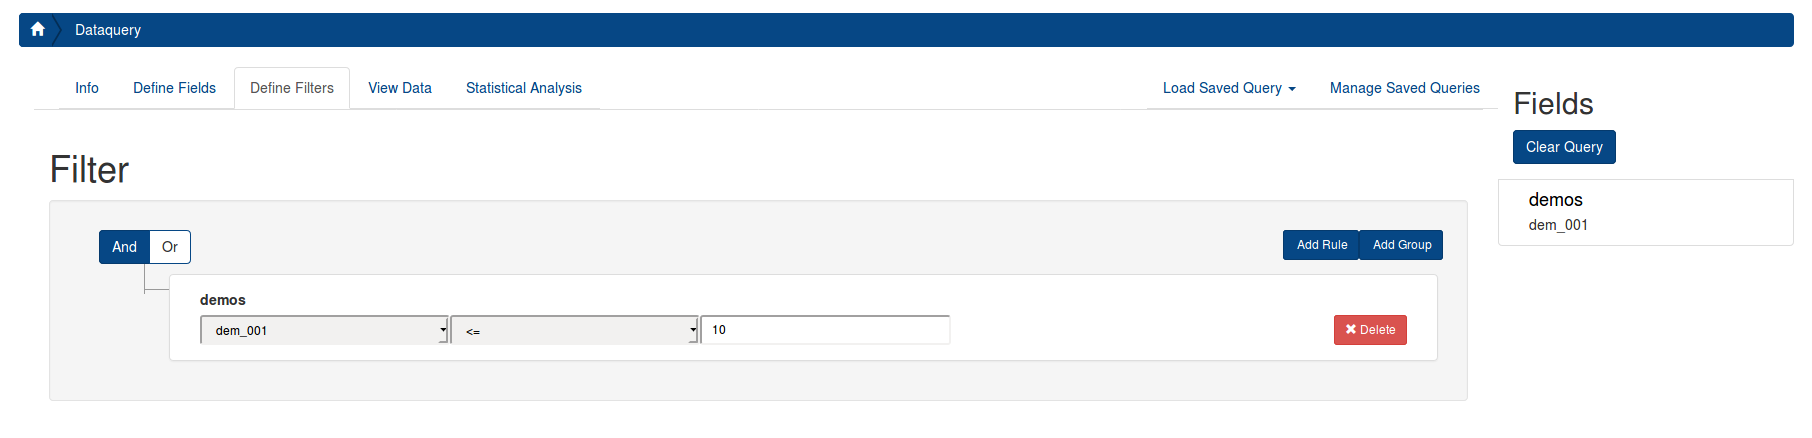
You can use the filter to restrict your data to certain conditions. For example, if you want to restrict the data to only children younger than 10, first select the instrument "demos", then select demos_01, the "<=" operator, and enter "10".
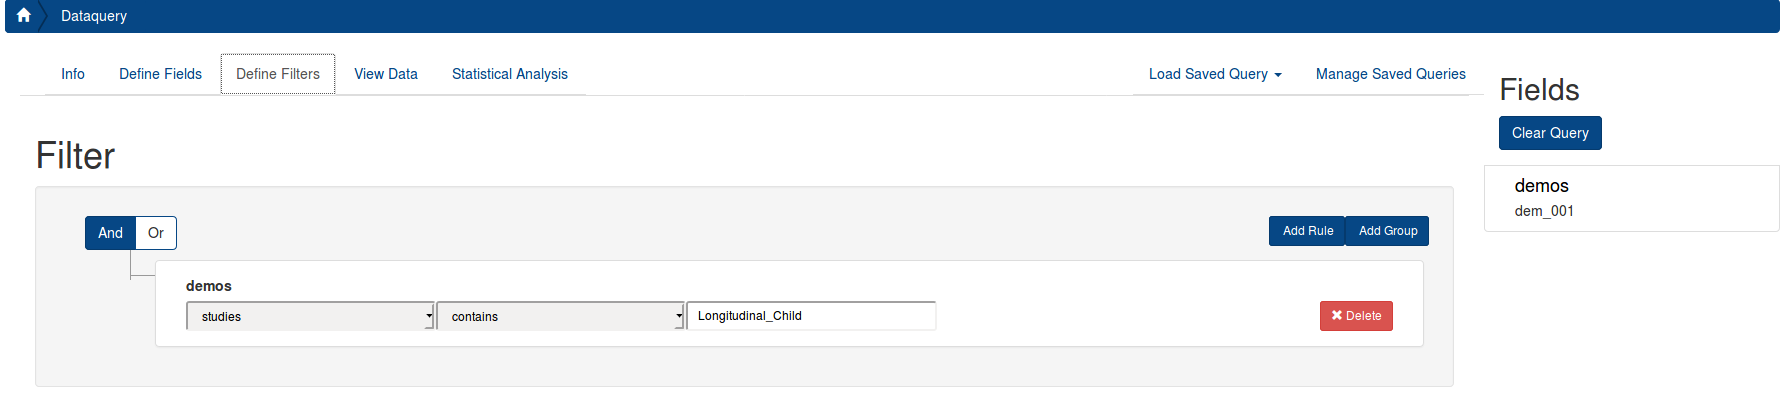
You can also filter on metadata. To filter only participants from the Child Longitudinal Study, you must select the “studies” field within the “demos” instrument, select “contains”, and write the study name or choose from the drop down [options: Longitudinal_Child, Longitudinal_Adult, Discovery, Neurofeedback], as seen below. Please note, if you filter on a variable with missing data, it will not return the complete dataset. The demos instrument is complete for all study participants with any data, so we recommend using it as the choice for your filter. If you want to filter on an instrument of interest and only return participants who have data for that instrument, you can select that instrument for your filter.
Details describing the metadata can be seen here) (Coming soon).
After you have finished defining your filters, you can go to the next step.
Step 5: View and Download Data
Finally to run the query, click the "View Data" tab, and click the "Run Query" button.
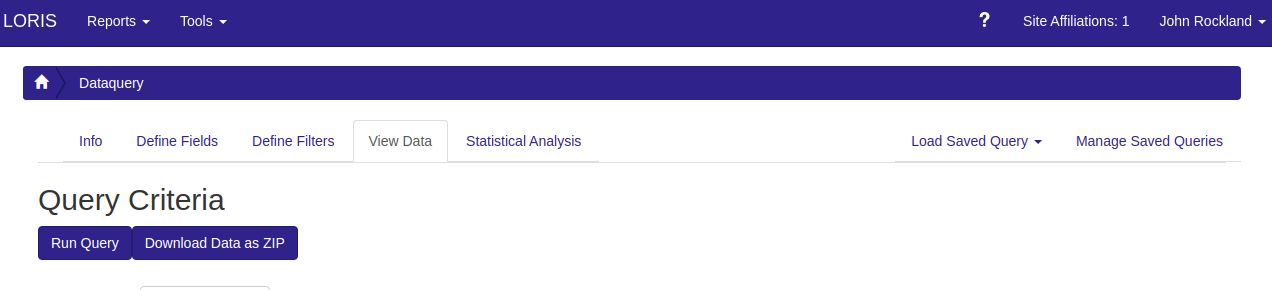
Scroll down and look at the data. Once you are satisfied with the selected and filtered data, you can export the data with the “Download Table as CSV” button.
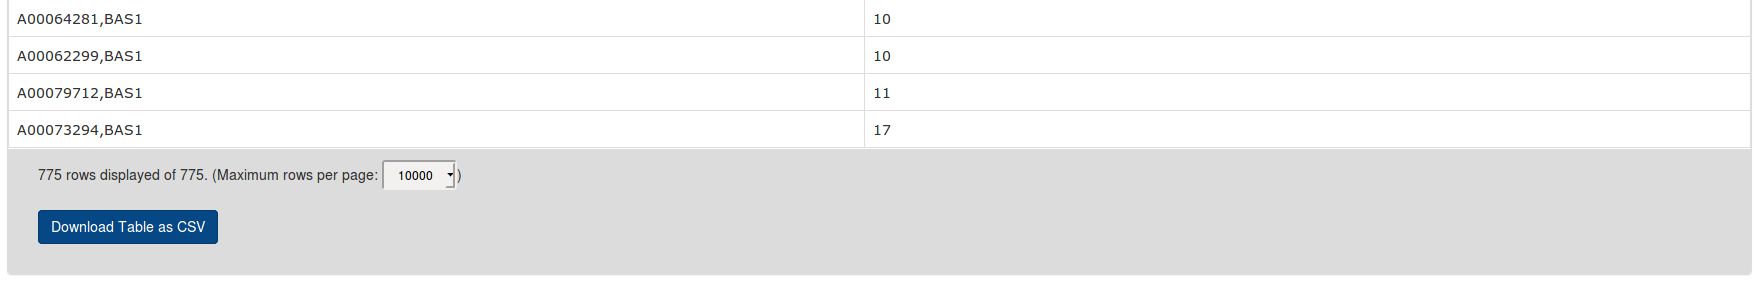

Table Of Contents
An open neuroscience project brought to you by: